Hub
Jump here first. You’ll see the classic conversion funnel - visitors turning into Web3 users, connecting wallets, and finally transacting - plus trending lines for activity and transaction value over time. A row of key metric cards sits up top for the numbers you check every day.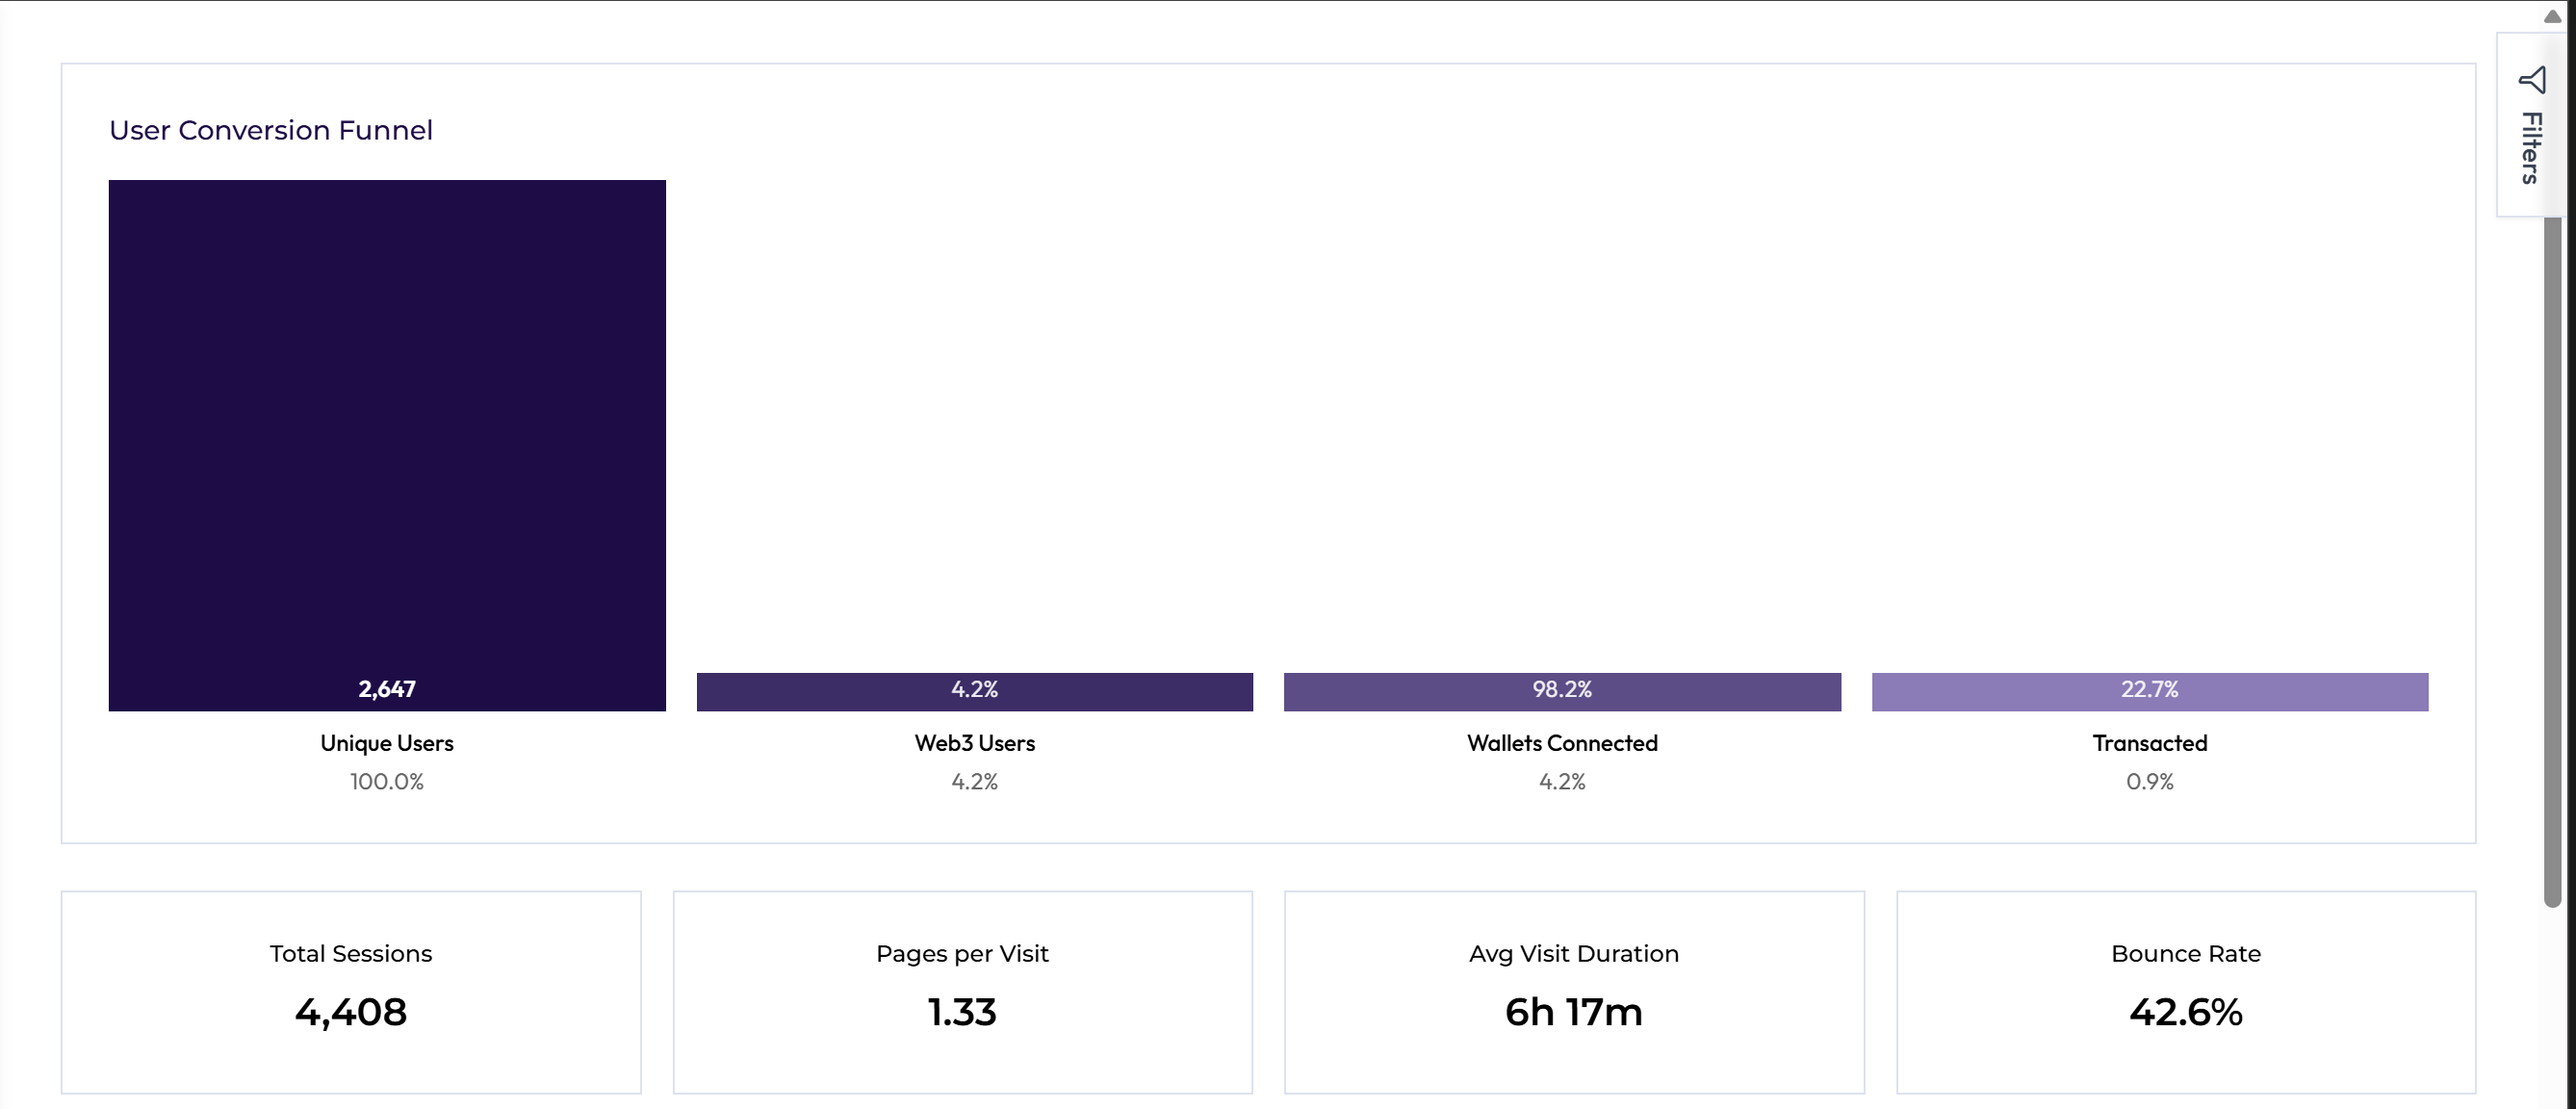
Source
This tab is gold for marketing and growth decisions. You get clean rankings of your top sources and countries, a smart scatter plot that shows which channels bring people who actually stick around and transact, and a full campaign performance table. Toggle between first-touch and last-touch whenever you want. Stop wasting budget on junk traffic and double down on the sources that reliably deliver users who look and act like your best ones.
Product Usage
Want to know how people really move through your dApp? This is it. You’ll see the most popular page paths, a heat map of interactions across pages, and a correlation view that connects behavior to outcomes.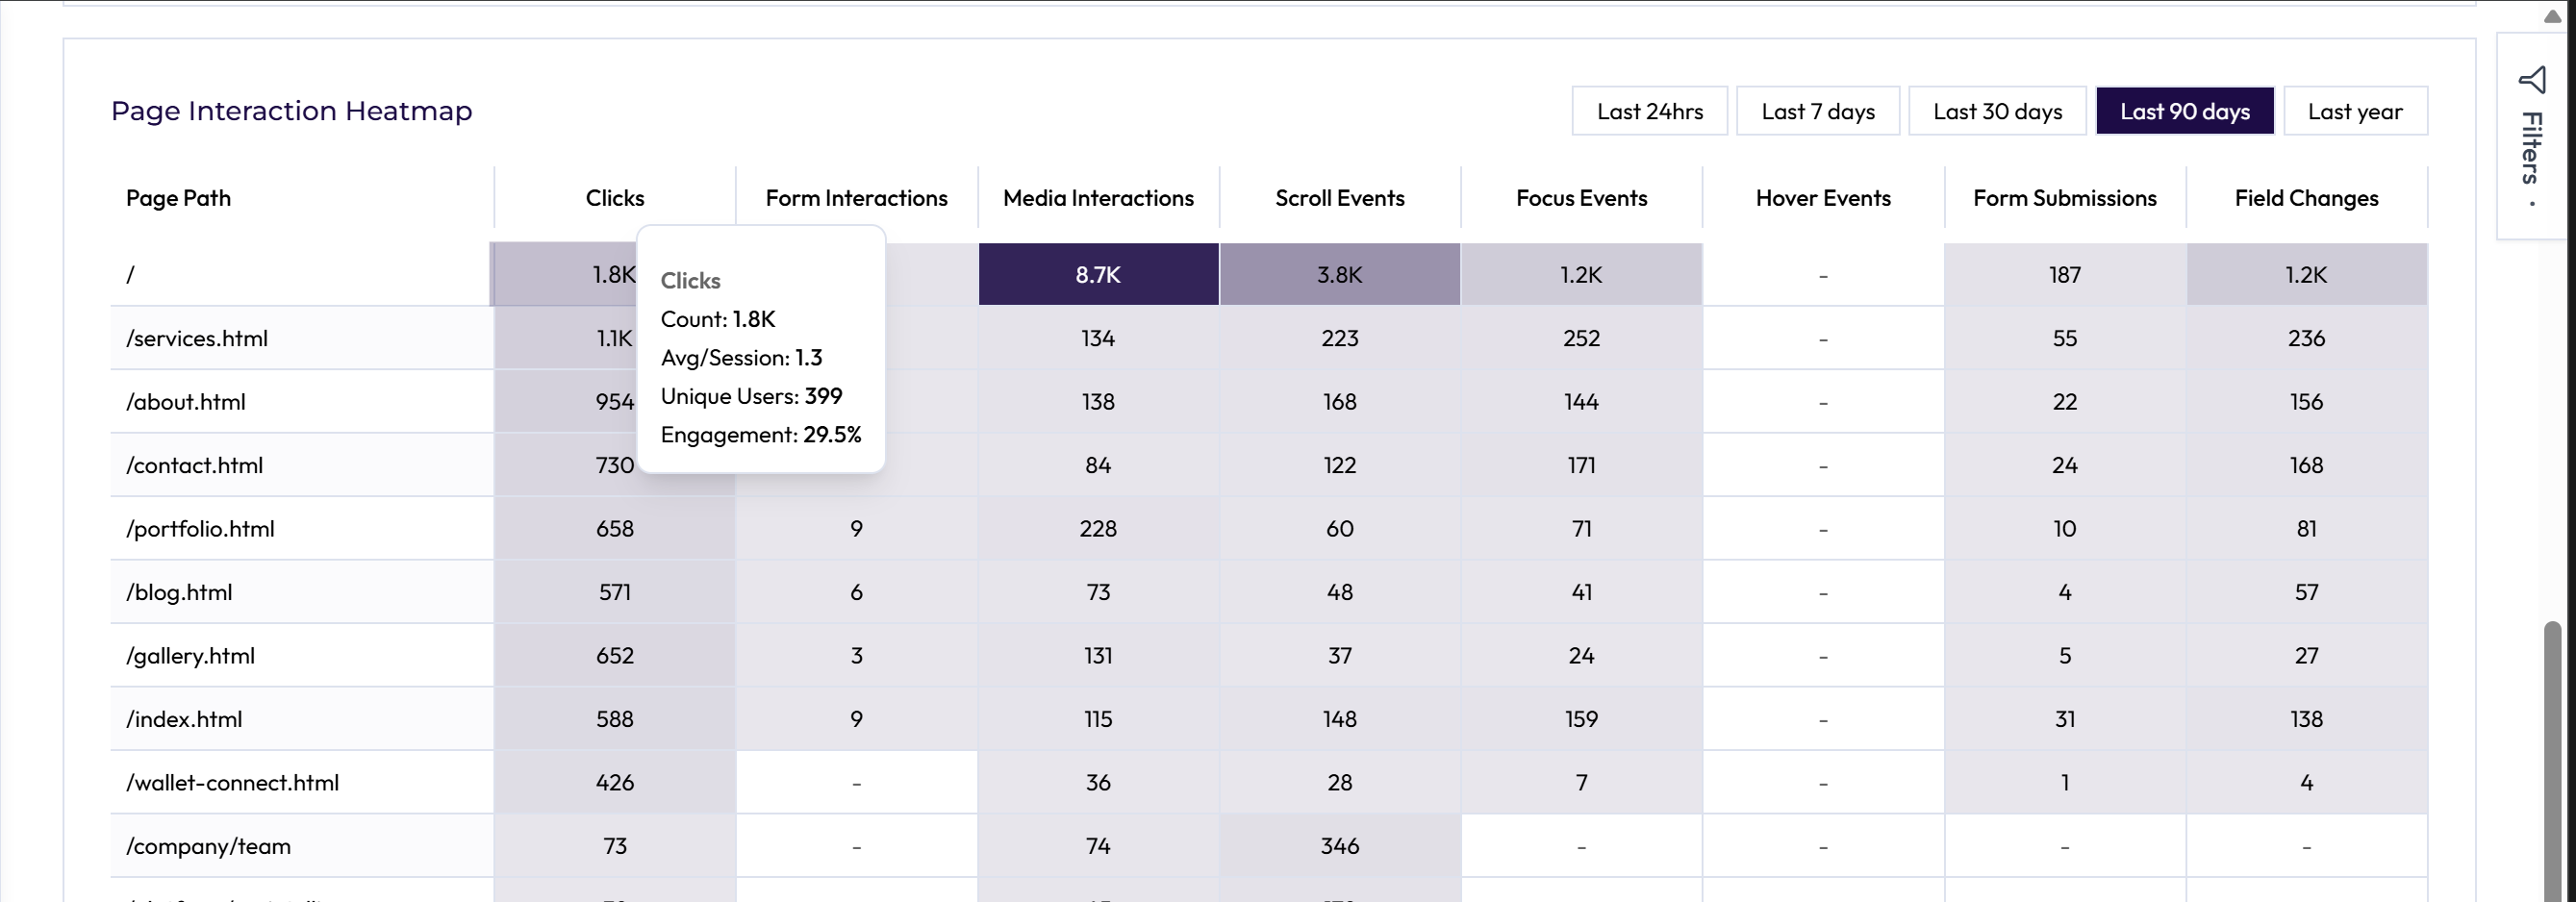
Onchain
Shift focus to the wallets hitting your contracts. Donut charts for wallet age spread, clean trend lines for transaction volume and value, and distribution curves for balances.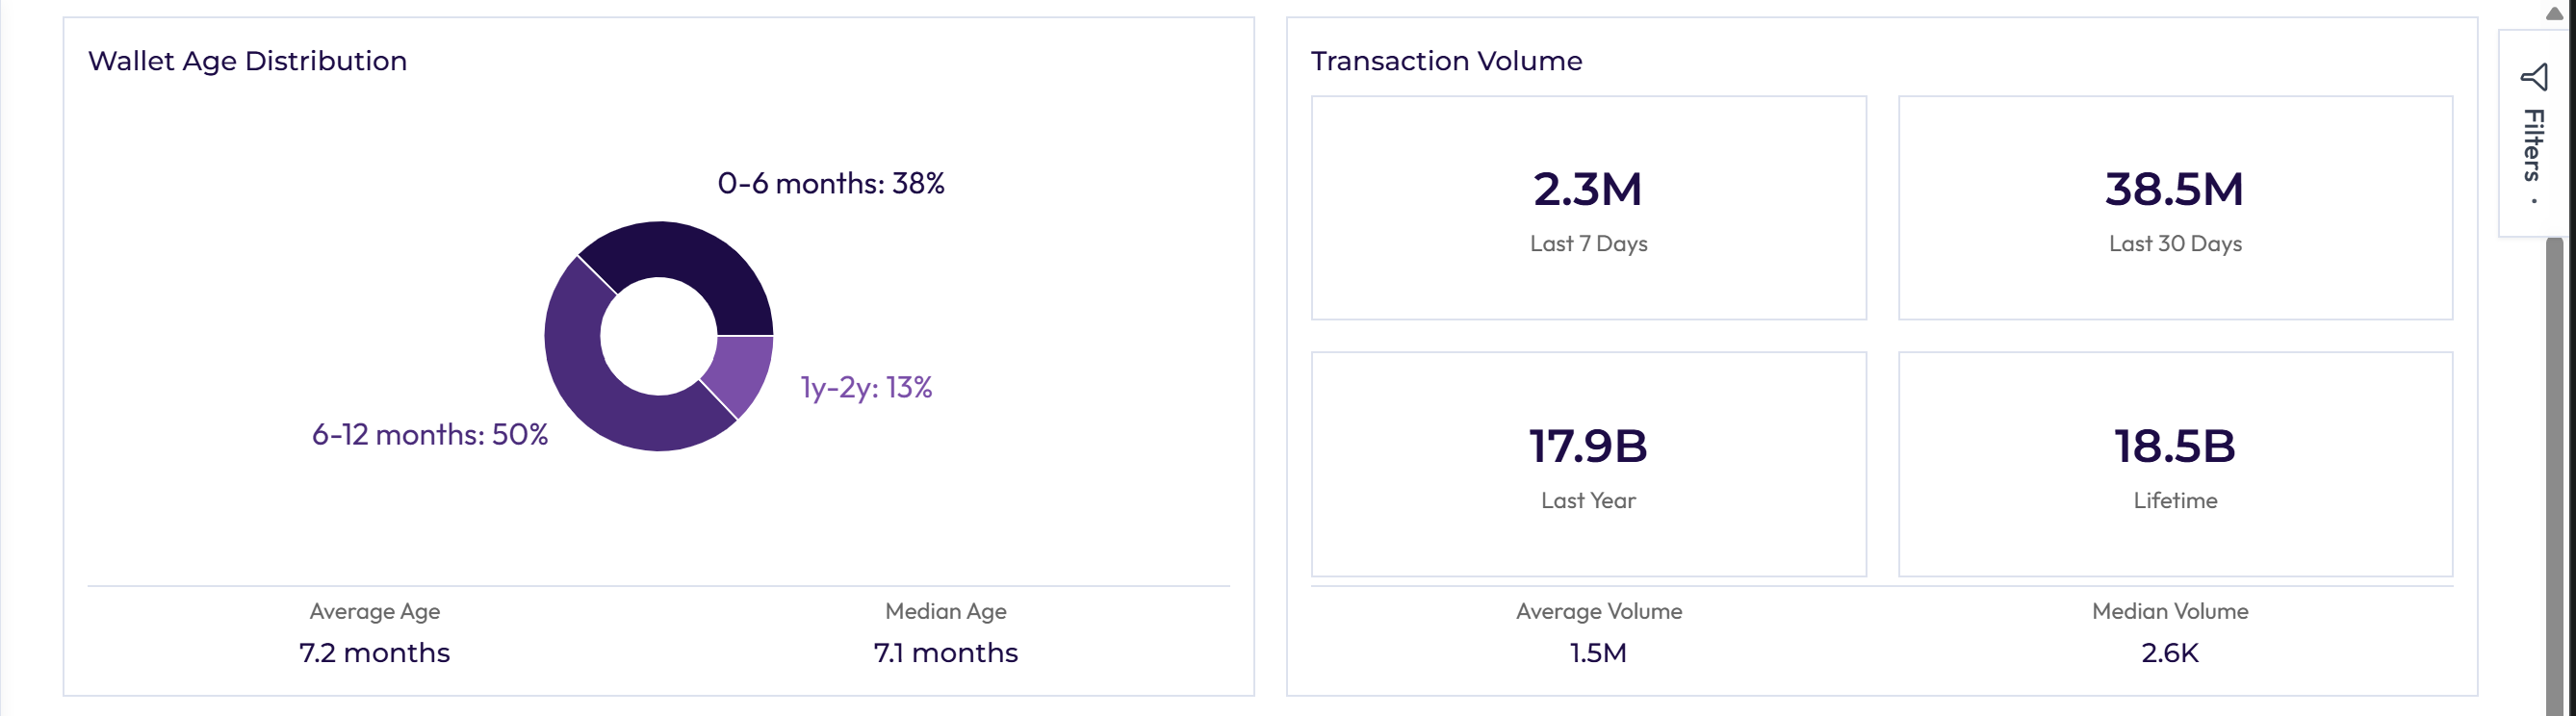
Retention
The ultimate truth serum. Daily/weekly/monthly active trends for both users and wallets, plus full cohort grids that show who comes back and how often.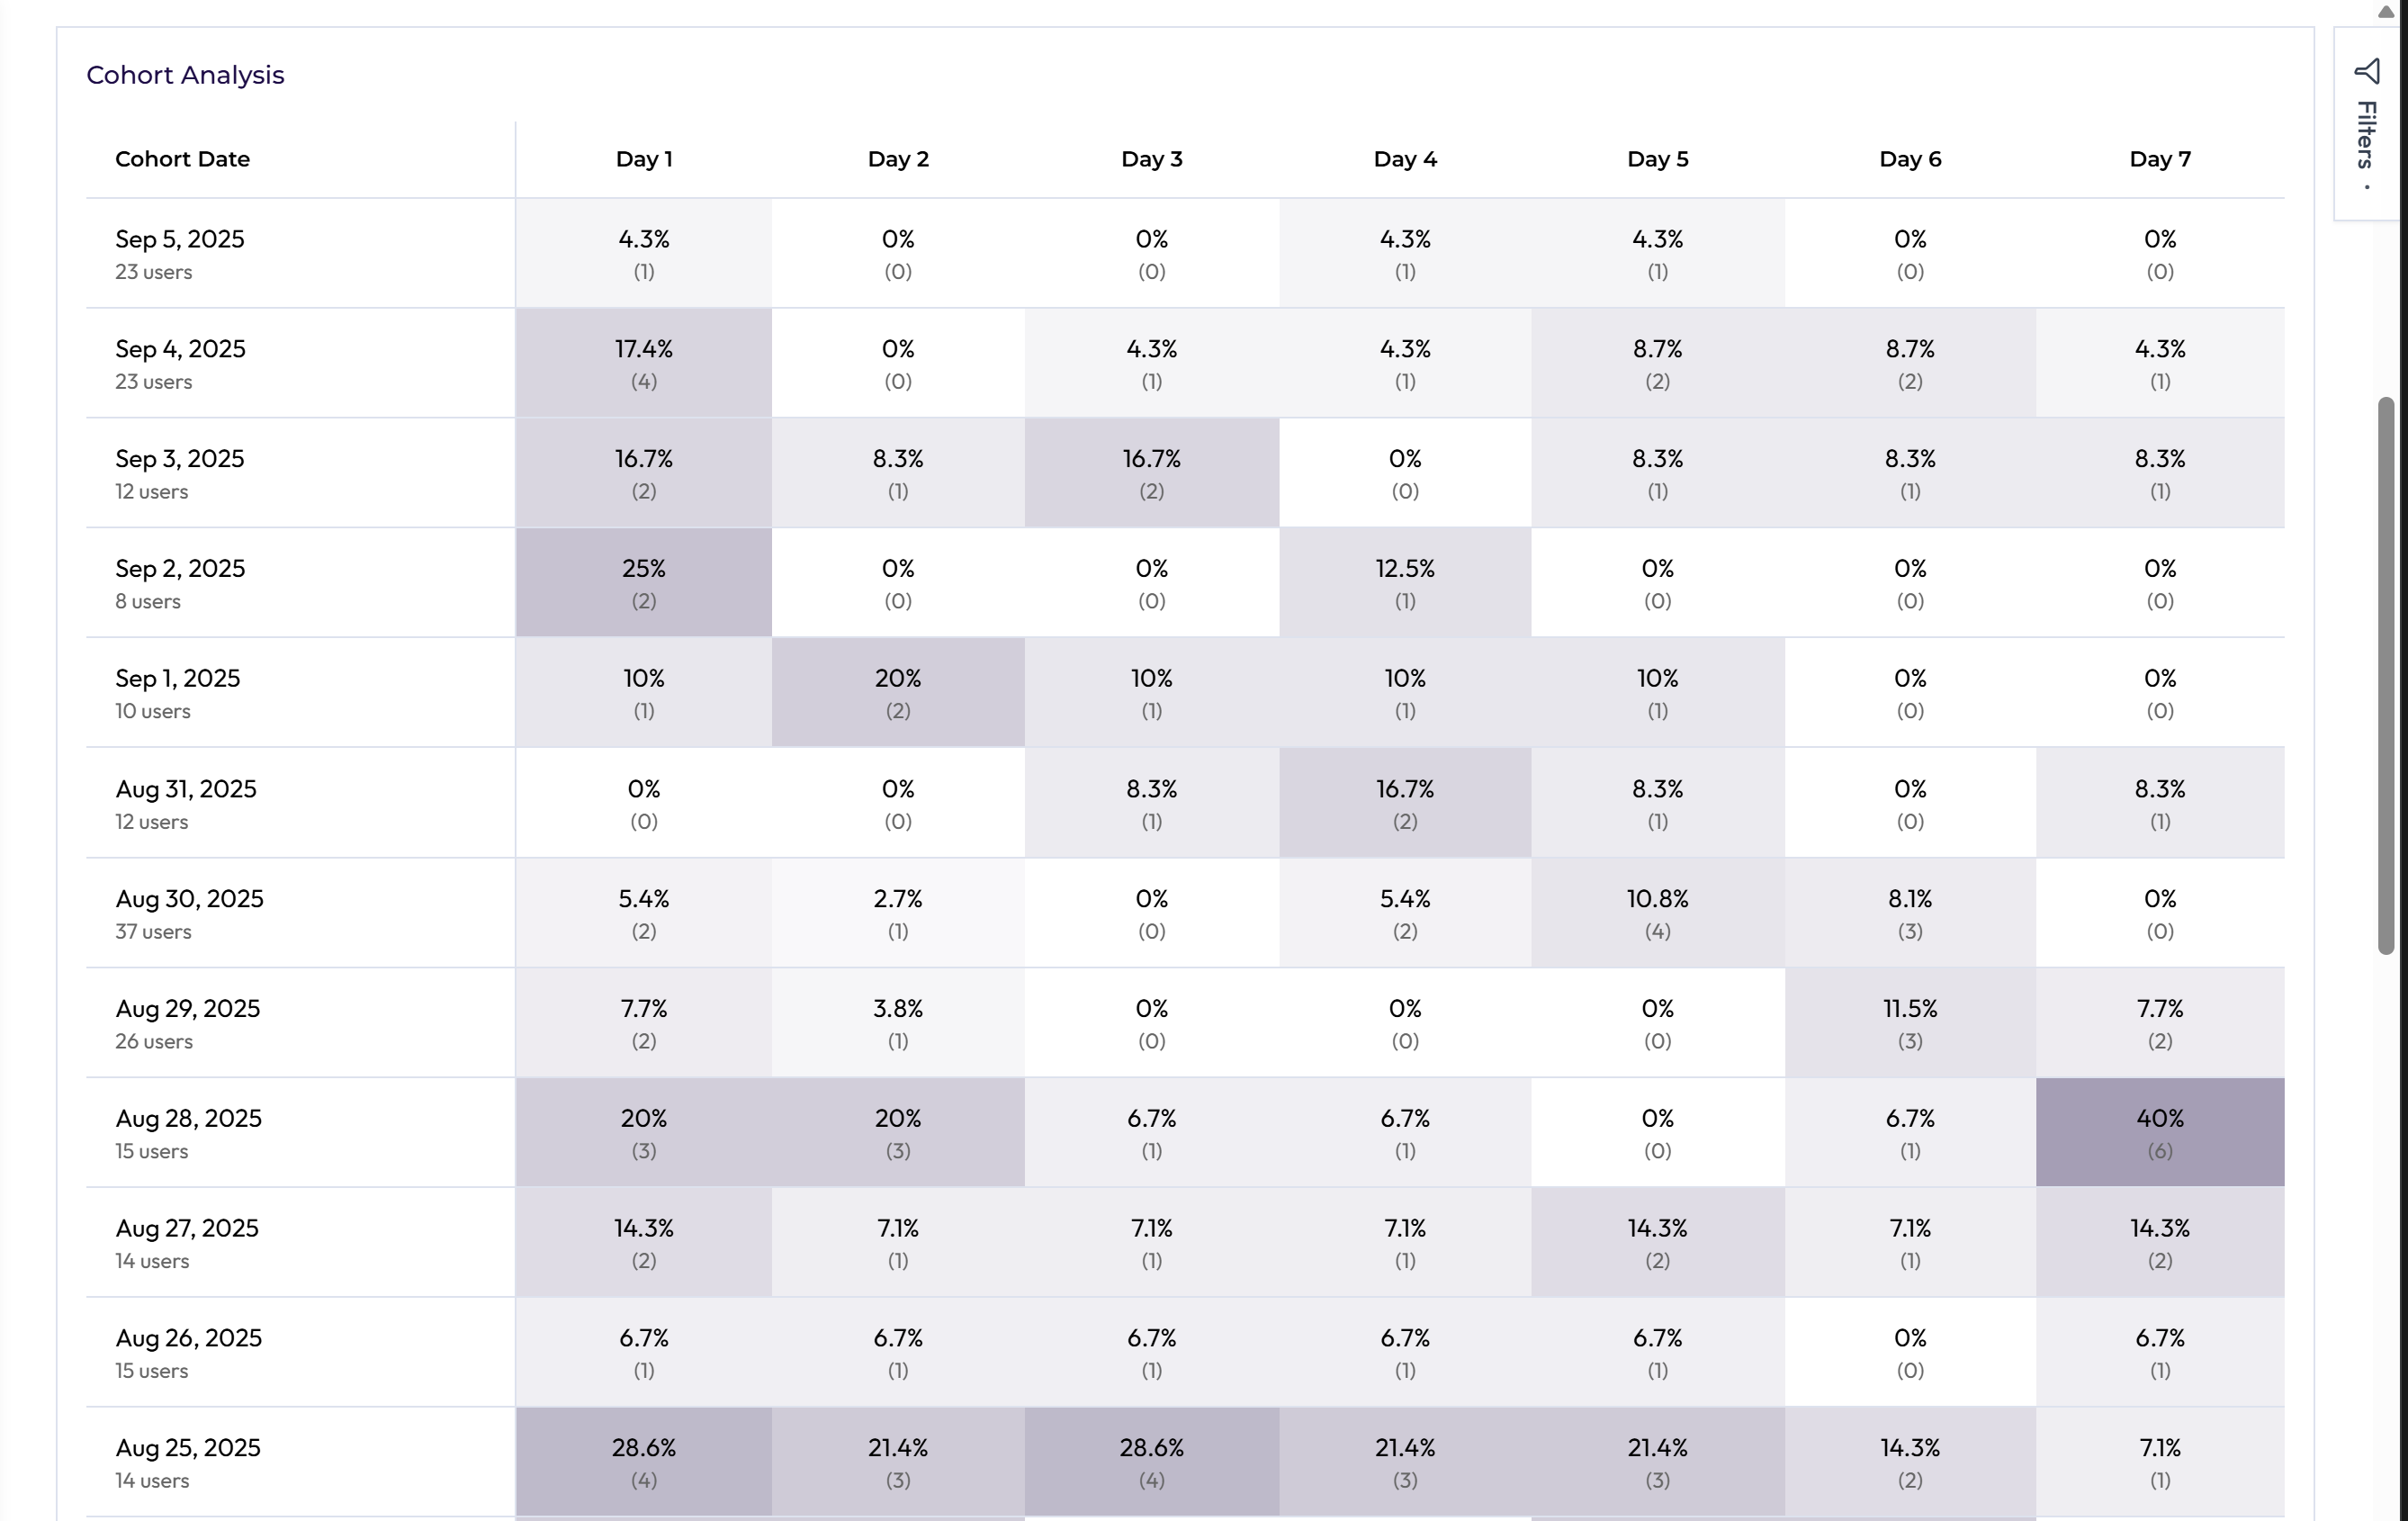
Wallet Summary
Ever wonder what one wallet is really worth across all your contracts? This tab stitches everything together into a unified view of each wallet’s total activity and contribution. Uncover your true power users, see cross-product engagement, and build stronger community or incentive strategies around the people who matter most.All tabs share the same powerful filters — time range, source, geography, device, Web3 status, net worth brackets, and more — so you can slice the data exactly how you need it. Bottom line: spend a couple minutes here each day and you’ll always know where to focus your energy for lower CAC, higher retention, and a stronger, more loyal audience. Ready for the deeper dive? Head to User Profiles next.